
June 2026
Special Focus—Gas Processing and LNG
Push the limits: Process improvements in an efficient amine unit
The authors’ company was contacted by a gas processing plant in Texas (U.S.) to evaluate a gas plant amine unit and perform an onsite audit and evaluation of the amine unit to determine capacity restrictions and what operations can be improved to increase process efficiency.
Amine unit contactor tower evaluation. The authors’ company was onsite to collect data, review process parameters and observe operations. The design of the amine unit was intended to treat primarily carbon dioxide (CO2) to meet specifications. This is done through splitting the gas and treating the gas flowrate equally in two parallel contactor towers. Each contactor has its own inlet coalescer and amine solvent regeneration stage. Both units are identical and appear to be performing similarly. Only Plant B was the focus of this study. FIG. 1 describes gas flow through the amine unit during the onsite visit. The parameters were gathered from field and control room data. The current conditions were used to evaluate the process.
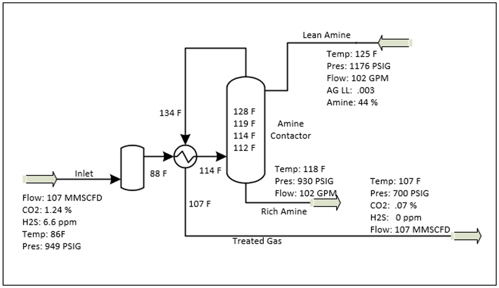
FIG. 1. Onsite conditions of Plant B amine unit.
As shown in FIG. 1, the amine unit was treating the gas to meet CO2 specification at the current inlet feed (107 MMft3d). An initial review indicated that the treated gas temperature was much higher exiting the amine contactor than either the inlet gas or the amine contactor. This suggests that the bulge temperature may be located at the top of the contactor tower. The tower's temperature profile from in the control room system confirmed that the bulge temperature is positioned higher in the tower. A bulge temperature located higher in an amine contactor may result in unstable operation due to most of the reaction occurring at the top of the tower. A slight change in conditions may result in off-spec product and can also cause increased carryover of the amine solvent during foaming episodes.
Due to the higher outlet gas temperature (compared to inlet), the process was further studied to determine any additional effects on the process. A thermal imaging picture was taken at the contactor to determine the bulge temperature (highest temperature exotherm) in the contactor and its location in the tower. This was also done for comparison purposes with the simulation work of the amine unit. FIG. 2 shows the location, bulge temperature and temperature profile in the amine unit contactor tower.

FIG. 2. Temperature profile of the amine contactor indicated by a thermal camera.
The contactor temperature profile indicated in FIG. 2 shows a bulge temperature near 127°F (53°C). The temperatures indicated by the thermal camera were found to be very similar to the temperatures obtained using the temperature probes in the control room. It is always recommended that an amine unit maintains < 185°F (< 85°C) bulge maximum temperature in the contactor to both minimize corrosion and improve acid gas [hydrogen sulfide (H2S)/CO2] removal performance. The location of the bulge temperature and temperature profile was located in the top sections of the contactor tower.
The recommended location of the bulge temperature in an amine unit is normally just above the feed gas inlet. A high bulge position is an indication of capacity restriction of the process, and only a few parameters can be changed (if possible) to lower the bulge temperature position in the contactor tower. Decreasing the inlet temperature of the lean amine and of the feed gas can assist in decreasing the bulge temperature position and improving CO2 removal. The flowrate of the amine solvent (increase) and the feed gas (decrease) can also lower the bulge temperature position. Since the flowrate of the feed gas cannot be changed easily, amine solvent flow change was evaluated using a commercial simulation package.
Simulation findings. A simplified simulation of the amine unit was used to determine the effects of decreasing the inlet gas temperature in the overall amine treating process. The simulator uses a mass transfer rate-based model for column calculations inside the amine contactor as opposed to equilibrium stage models used in other commercially available simulators.
To simulate the process properly under normal conditions, feed gas and lean amine were collected from recent analyses and field operations. The conditions used for this simulation and review are shown in TABLE 1.

The full composition of the feed gas was provided by the plant and used in the simulation. In addition, several design drawings and schematics of the amine contactor were collected, and information on the sizing and tray design was incorporated into the simulation protocol. Parameters such as the number of trays, tray spacing, tower diameter, tray/valve type and tray active area were all used as inputs for the simulation calculations.
The simplified simulation setup of the contactor is shown in FIG. 3. The feed gas composition and process conditions were input into the feed gas block of the simulator. In addition, the amine solvent formulation, amine analysis results and process conditions were all used as inputs into the lean amine block of the simulator. The tower internals information, tray ratings and designs were all used as inputs to the contactor block of the simulator. The simulation was then performed to proper convergence, and conditions for the rich amine and treated gas streams were obtained as outputs of the simulator. Note: Due to proprietary information, the exact composition of the amine solvent is unknown and may be the reason for slight differences in calculations. The solvent was MDEA-based formulated with an activator, likely piperazine.

FIG. 3. Simulation setup of the contactor tower.
Results and data interpretation.
Several different scenarios were simulated by varying three key parameters:
- Feed gas temperature
- Lean amine temperature
- Lean amine flowrate.
The objective of the study was to determine if the above scenarios would have a significant effect on acid gas removal performance or bulge temperature location to limit upsets.
The Base Case conditions resulted in very similar results to what was indicated in the actual amine unit. However, it must be noted that the CO2 concentration in the treated gas differs slightly from the actual CO2 concentration. This could be due to outdated solvent analysis and other variabilities (e.g., activator concentration). The results are within the range for comparison purposes needed for this study.
The results (TABLE 2) show the effects of varying the feed gas temperature, lean amine temperature and lean amine flowrate at current conditions on the treated CO2 concentration and bulge temperature position in the tower. All cases were performed within the ranges of the base conditions given, at the same conditions except for those shown in TABLE 2.
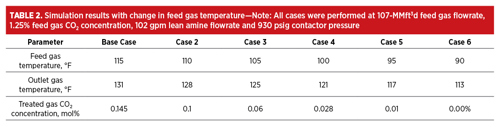
The feed gas temperature was varied from 90°F–115°F (32°C–46°C), while all other parameters remained the same. TABLE 2 shows that lowering the feed gas temperature led to improved CO2 removal performance. In addition, the decrease in treated gas temperatures indicated both a lowering in bulge temperature and a shift in position lower in the contactor tower.
There were concerns that reducing the feed gas temperature would cause liquid hydrocarbon condensation in the contactor tower. This possibility was explored and evaluated by creating a phase envelope for the feed gas composition by determining via the simulator the bubble and dewpoints of the feed gas at varying pressures. FIG. 4 shows the results of the phase envelope for the inlet gas. The blue plot is the boundary between the gas phase and a dual phase gas/liquid. Therefore, operating above the blue plot ensues that the feed gas remains as single-phase gas only mode (no liquids condensation).

FIG. 4. Phase envelope of inlet gas.
The inlet gas phase envelope shows that no liquids should condense at the current operational temperatures. However, a drop in ambient temperatures during cooler months can potentially condense liquids caused by a decrease in feed gas temperature and crossing into a dual flow regime. The same was determined for the treated gas dewpoint. No hydrocarbon condensation should be expected in the contactor tower if a minimum temperature of 90°F (32°C) is achieved.
The inlet exchanger E-1701/2701 could be partially bypassed to obtain a lower inlet gas temperature. However, operations should maintain temperatures > 85°F (> 29°C) to minimize any condensation of hydrocarbons. Operating between 90°F and 95°F (32°C and 35°C) would achieve the best results for improving gas treating, decreasing bulge temperature while maintaining minimal hydrocarbon condensation.
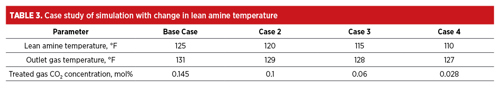
The results from the change in lean amine temperature—with all other parameters remaining the same—are described in TABLE 3. The results indicate that the CO2 absorption improves while the outlet temperature decreases slightly.
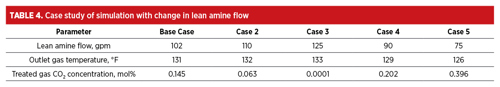
The results from the change in lean amine flow (gpm) with all other parameters remaining the same are described in TABLE 4. The results indicate that the CO2 absorption is improved with increased amine solvent flow; however, the temperature increases, indicating a higher positioned temperature profile.
Optimized Case. TABLE 5 details the Optimized Case to improve CO2 removal and process stability. The gas exchanger can be bypassed to decrease temperature, but this is not always as easy for the lean amine temperature. If the lean amine temperature cannot be reduced with the lean amine cooler, then the regeneration duty can be reduced. Decreasing the regeneration duty would require a close evaluation of the lean amine acid gas loadings (described below).
The two cases were evaluated to determine if hydraulics remain in capacity in the contactor tower using the mass-transfer simulator. It was determined that all parameters remained within guidelines. The results are discussed in the section below.
Coalescer vessel review: Coalescer design. The design of the inlet gas coalescer vessel was evaluated for any deficiencies that may reduce the overall liquid removal efficiency. FIG. 5 shows the 36-in. outer diameter (OD) x 10-ft. seam to seam gas coalescer vessel design (FI-2000). The vessel was simulated through the authors’ company’s proprietary coalescer program to determine internal flow parameters. The vessel was also evaluated by determining key performance indicators (KPIs) for the system at its current operating conditions. The vessel housing accommodated 18 gas coalescer cartridge style elements measuring 5 in. in outer diameter at their base and 36 in. in length with sealing mechanisms using gaskets at the bottom section. The inlet and outlet gas connections were 14 in. in diameter. Normal operating conditions (worse case) of 105 MMft3d, 90°F and 950 psig were used for this evaluation.

FIG. 5. A drawing of the F-1701/2701 inlet coalescer.
The F-1701/2701 feed gas coalescer vessel, shown in FIG. 5, is sized appropriately (vessel diameter) for the normal operating conditions at 105 MMft3d in terms of critical design values. Up to 210 MMft3d can be processed through the vessel before critical design values exceed recommended limits (annular velocity exceeds 8 ft/sec). While the vessel itself seems to be designed correctly (in many aspects) according to the design drawing, some deficiencies are noted.
The annular velocity is the speed of the gas flow in the void space between the elements. This is a critical parameter since a high exit gas velocity from the coalescing elements will usually produce liquids carryover into the effluent gas stream. An ideal annular velocity is generally < 8 ft/sec. Carryover is common in undersized vessels or in vessels with deficient internal flow geometry. The estimated annular velocity in the vessel at the operating conditions used was 3.2 ft/sec, well within recommended guidelines.
The effective media face velocity is the speed of gas moving through the coalescing media. If the media face velocity is too low, a phenomenon can occur in some cases where liquid droplets do not have enough energy to coalesce because of the elastic droplet interface, which reduces removal efficiency. If the media face velocity is too high, droplets will be swept through the coalescing media without coalescing, which leads to liquids carryover. Undersized vessels that have an insufficient number of elements or elements with low media surface area often perform poorly in terms of liquids coalescence due to high media face velocity. An ideal media face velocity is generally 0.5 ft/min–8 ft/min, but this depends on several factors: viscosity, surface tension, and other properties of the contamination in the stream influence coalescence. The effective media face velocity at the operating conditions used was estimated at 2.01 ft/min, within recommended guidelines. Removal efficiency may decrease at flowrates of ~40 MMft3d or below due to low media face velocity (insufficient coalescing energy). The optimized flowrate for this vessel should be maintained between 50 MMft3d and 210 MMft3d.
If the vessel is expected to perform at lower rates for longer periods of time, coalescer elements plugs can be placed inside the vessel to help with efficiency. The spacing between the bottom of the outlet nozzle and top of the element is only 8 in., whereas > 10 in.–15 in. of spacing is recommended to prevent droplet carryover from high velocity near the outlet. The upper-level gauge in the upper section is above the bottom of the elements, so any level that exceeds ~20% will cause coalescing element media flooding. This is a critical aspect, and liquid level in the upper stage must be carefully monitored to avoid element flooding at the bottom section leading to liquids carryover.
The lower section is sufficiently large to accommodate some free liquids, and level gauge placement there is appropriate. The inlet diverter design cannot be evaluated from the vessel drawing provided; a detailed design drawing should be reviewed to determine if the design is appropriate and does not cause droplet shattering via direct impingement to a surface (droplet shattering reduces aerosol size and increases particle count, making separation more difficult). Inlet diverters often route the gas to certain internal elements preferentially, overloading them and also leading to liquids carryover. The tube sheet riser/element seal should be inspected to determine type as liquids carryover often occurs through flat gasket seals, while O-ring seals perform more effectively. The top element seal should also be inspected to ensure an adequate seal.
Liquid evaluation. Several parameters were obtained during the visit to the facility. FIG. 6 shows the amine process flow and some of the key parameters that were recorded. The highlights from the evaluation are discussed in the following sections.
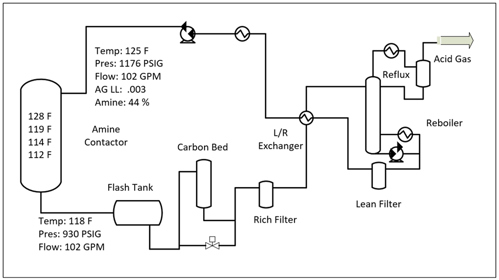
FIG. 6. Amine flow and essential operating parameters.
Flash tank. The flash tank is a bucket-style flash tank, seen in FIG. 7. Both flash tanks were controlled at a 20%–25% level. It is recommended to maintain the level closest to the top of the bucket as possible. A flash tank with a higher liquid level will allow for more stable control of the unit, and removing contaminants into the weir becomes more feasible for operations to do routinely. Skimming the flash tank should be done routinely (every 1 d–2 d), especially after upsets. Antifoam often separates in the flash tank, and the best way to remove the antifoam from the process is periodic flash tank skimming.

FIG. 7. An amine flash tank with a thermal image to indicate the bucket location.
FIG. 7 illustrates the bucket in the flash tank. At the time, no skimming (4-side valves) or bucket dumping (bucket drain) were performed: no connections were available to easily accomplish skimming. It was recommended to add a skimmer line with a periodic skimming routine for best operations.
Activated carbon bed. The activated carbon bed was evaluated to determine the maximum amine flowrate it can process effectively. The bed was 10 ft tall (seam-to-seam) with a bed height of approximately 6.2 ft, and the vessel inner diameter was 40 in. Amine flow entered the vessel through the top nozzle and flowed downward through the bottom drain nozzle.
The recommended flux (or superficial velocity) through the bed is 2 gpm/ft2–4 gpm/ft2, and the flux should not exceed 5 gpm/ft2. The contaminant removal performance begins to decrease at high fluxes due to insufficient contact, and removal performance begins to decrease at low flux due to channeling. Amine flows through a cross-sectional surface area of 0.81 m2, so the recommended flux is achieved at flowrates between 17 gpm and 43 gpm. The maximum filtration flux guideline of 5 gpm/ft2 will be exceeded at 43 gpm.
Effective contact time, however, is the most important factor for activated carbon adsorption of contaminants in amine solvents, and achieving adequate contact time should take priority over the recommended criteria for flux. Effective contact time is the amount of time the amine solvent is in contact with the activated carbon, considering the volume displacement of the carbon itself in the bed. It has been shown in several studies and observed in field experience that contaminant removal efficiency decreases substantially at effective contact times of < 15 min. The minimum effective contact time of 15 min is achieved in the bed at ≤ 20 gpm amine flow.
It is additionally recommended to process at least 20% of the total amine flowrate through the carbon bed, if possible, but this should only be done if the criteria for effective contact time and flux are satisfied. The total amine flowrate would have to be ≤ 100 gpm to process a 20% flow through the carbon bed and achieve the minimum effective contact time. It is recommended that the amine flowrate through the carbon bed not exceed 20 gpm to achieve an effective contact time > 15 min. The flux at this flowrate (2.29 gpm/ft2) would be well within the recommended range, and 20% of the total amine flow would be processed at the normal recirculation rate of 100 gpm. It is also recommended that the amine flowrate through the carbon bed not drop below 17 gpm to achieve a flux above 2 gpm/ft2.
The optimal flowrates for the carbon bed are 17 gpm–20 gpm. This is a very limited range, so it should be controlled via an operations control valve. There is a control valve onsite to bypass the carbon bed, but the valve is being controlled based on differential pressure (dp). It is recommended to input gpm into the control room to allow for the most accurate control of the carbon bed. At this rate, a carbon bed should be changed out once a year unless higher contaminants enter the facility requiring a change-out at a sooner date. Activated carbon should be changed every 6 mos–9 mos, depending on antifoam use and the concentration of inlet contaminants.
Laboratory analysis: Foam testing. Several samples were taken from the unit and tested offsite in the laboratory for foam tendency and stability. Each foam test sample was evaluated with a foam test kit assembly (FIG. 8) under standardized procedures to obtain consistent and reproducible results. The foaming test kit consists of a glass column equipped with a porous glass frit for homogenous gas dispersion. Air is pumped into the inlet across the porous glass frit and into the cylinder section where the sample is added. The flow of air is metered into the system, so results are reproducible and consistent throughout each test. The air is introduced and the foam height is measured in centimeters. Air flow is then turned off and the time for the foam to break is recorded. The test is repeated two to three times for reproducibility. The average result is used for reporting values.

FIG. 8. Assembled foam test apparatus.
The amine solvent foaming test conditions are detailed here:
- Sample volume: 70 ml
- Air flow: 1 liter (l)/min
- Air flow time: 10 sec
- Break time: Until foam completely dissipates
- Break rate: Foam height/break time.
The results from the foam tests are shown in TABLE 6. The lean amine solvent showed high foam stability (measured by the foam break time) often caused by contaminant presence. The rich amine post carbon appeared to present similar results, therefore the activated carbon was considered as spent and was recommended to be replaced. Reflux water and make-up amine as indicated also showed foam stability (not as much as the amine solvent, however). It is recommended to perform periodic foam testing of the lean amine solvent pre-carbon and post-carbon, and other samples such as reflux water. These routine tests determine the state of the amine solvent and its level of cleanliness over time. With trended and monitored foam test results, foaming upsets can be foreseen and preventive actions can be made proactively.
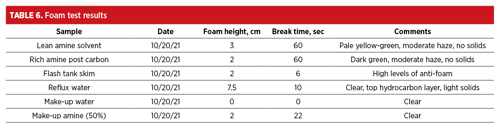
The reflux water was also found to have high foaming tendency (foam height). Reflux water should be dumped or skimmed routinely to maintain good amine hygiene. The small hydrocarbon layer on the surface was likely one of the causes of the foaming tendency. The make-up water and amine solvent were also tested for foam and were found to be slightly higher than recommended (though that could be due to an incorrect sampling). Both the make-up amine solvent and make-up water should be inspected routinely to ensure clean deliveries are made with no foam and/or other contaminants. Both fluids should be transparent with no haze, no visible solids and separate phases.
Antifoam screening. Antifoam screening was performed to evaluate the effectiveness of the antifoam. Every plant reacts differently to an antifoam as different contaminants enter the facility. The authors’ company does not recommend using antifoam if not required, although it is sometimes required to recover from a foaming event. In the case of a foaming event, the best and most effective antifoam should be used so the amount of antifoam injection is as small as possible with the largest foam reduction impact on the unit. Antifoam for the amine contactor is recommended to be injected upstream of the lean amine solvent solution pump. The results from the antifoam screening are described in TABLE 7. It was found that the antifoam in use at the unit was ineffective and actually increased the stability of the foam. However, AF-12 and 16V were found to be very effective at foam control.

Amine solvent analysis review. The lean amine was yellow-green in color, had no appreciable suspended or decanted solids, and presented no separate phases. The sample had moderate haze (hydrocarbon emulsions). The chemical analysis indicated high acetates, usually from oxygen degradation or acetic acid ingression with feed gas. The bicine is borderline high (245 ppm), suggesting oxygen ingression with feed gas. However, the fact that the iron is low (2 ppm) is not a great concern, as the bicine is dormant or inactive. Generally, if bicine is high and iron is also high, it indicates process corrosion by metal chelation is taking place. Chlorides, sodium and potassium levels are also high, indicating produced water ingression with the feed gas or possible heat stable salts neutralization. Feed gas contamination ingression can potentially be mitigated using a water wash system of the feed gas.
Takeaways and recommendations. The audit of the amine unit determined that most of its operations are in good standings. However, the general overview of the unit has led to a few recommendations to further improve performance of the unit without any large capital investment.
The authors’ company recommends the following actions:
- Improve the skimming/dumping schedule of the amine flash tank
- Dumping routinely will improve the hygiene of the amine and the carbon bed capacity
- Increase the level in the flash tank
- Increase the level with increased stability of the regenerator and make skimming easy
- Control the carbon bed flow to between 17 gpm and 20 gpm
- The flow may need to be calculated directly to the control room
- Route injection of antifoam upstream of the lean amine solvent pumps
- Dump/skim the reflux accumulator more routinely, especially after an upset, to mitigate contamination build-up
- Switch to a higher performing antifoam, such as AF-12
- Decrease the amine lean amine temperature to 110°F (43°C)
- Due to the low lean loading, there is room to decrease regeneration to help with temperature control
- Increase the amine solvent flowrate to 110 gpm
- This can be done to help push the bulge just slightly lower in the tower
- Decrease the gas inlet temperature
- Keep hydrocarbon temperatures above 85°F (29°C) to prevent condensation
- Carefully monitor the inlet gas coalescer upper liquids level to avoid element flooding at the bottom section, leading to liquids carryover.


Comments