2021 AFPM Summit Virtual Edition: Improve reliability and optimize maintenance with advanced analytics
ALLISON BUENEMANN, Seeq Corporation
A common misconception in large-scale process manufacturing is that minimizing downtime is the key to increasing profitability. This mindset fails to address the fact that some downtime can improve capacity, increasing production and revenue. The most effective operations maximize production by striking a balance between reducing costly unplanned downtime and utilizing proactive, calculated downtimes to restore or increase throughput capacity.
Reducing unplanned downtime requires understanding the leading causes. It involves identifying historical losses, analyzing root causes and categorizing them in a way that can be easily summarized and consumed by relevant stakeholders. Production loss accounting is a taxing drain on valuable process engineering resources, consuming hours to days of their time each month. Reducing the time to insight for this analysis frees up engineering resources to make effective use of the data to reduce unplanned downtime through design and implementation of process improvements.
Calculated, opportunistic downtime is a paradigm shift from the mentality of keeping a process unit running at all costs. An optimization problem must be solved to identify the minimum time to order fulfillment. Traditional solutions to this problem typically rely excessively on assumptions and are highly complex. A simpler, more transparent solution is required to achieve buy-in of this new operating strategy at all organizational levels.
Both problems can be addressed with advanced analytics solutions in the hands of front-line subjects matter experts (SMEs).
Traditional approaches encounter insurmountable limitations. As the field of data analytics advances, users are identifying and solving more computationally complex problems, revealing a host of insufficiencies in their traditional spreadsheet-based calculation tools. Leading limitations include data connectivity and access, computational performance, collaboration and versioning, and visualization and reporting functionalities.
Process data must be overlaid with contextual information, such as operator logbook notes or maintenance work orders. Establishing a live connection to these types of data sources is challenging—without it, engineers must extract data from multiple databases and aggregate it somewhere, most commonly in spreadsheets. Spreadsheets encounter performance limitations when dealing with highly complex calculations or high data volumes. Spreadsheets reach row and column limits, and they become increasingly difficult to manipulate as file size increases.
Other spreadsheet limitations include minimal higher-order modeling functionalities and a lack of multiuser collaboration, which has become increasingly important as workforces adapt to a remote environment. Online tools allowing simultaneous input from multiple users are replacing offline versions, while spreadsheets and traditional desktop-based statistical modeling software present version management issues and barriers to collaboration.
Advanced analytics solutions overcome limitations. Browser-based advanced analytics software applications like those provided by Seeq have filled the gaps left by spreadsheet-based calculation and reporting tools. Data connectivity and refresh, computational capacity, interactive visuals and live updating summary dashboards are now well within reach.
Advanced analytics applications provide out-of-the box connectors to process data historians and SQL-based contextual databases—making process, maintenance, shift log and other data available to SMEs from a single application. Data sources are indexed, not replicated, maintaining the integrity of the source system as a single point of truth.
The combination of a versatile visualization pane and a robust calculation engine enables intermediate visual feedback and rapid iteration of analyses. Visualizing all the steps in a workflow enables users to identify potential issues sooner, troubleshoot more efficiently and minimize recycle time.
A set-it and forget-it dashboarding and reporting tool with a live connection to the data embedded in the visualizations saves engineers significant time that was previously spent updating and formatting reports. Auto updating or scheduled date range configuration ensures high-horsepower calculations are run at optimal times, with reports ready for other users at a time of their choosing.
Use cases demonstrate data-driven operating strategies in practice. Seeq’s advanced analytics application has been deployed across industries to enable customers to maximize long-term production, as shown in the following examples.
Identification, categorization, summary and reporting of production losses
- Challenge: Manufacturing companies must track and categorize performance losses to identify bad actors, justify improvement projects, and perform historical and global benchmarking. This is a tedious activity that can cost process engineers days of work each month. Loss events must be investigated, categorized and aggregated into summary reports that convey overall equipment effectiveness and reliability bad actors. Effective use of this data can inform decision-making on capital project spending to remove process bottlenecks and upgrade unreliable equipment.
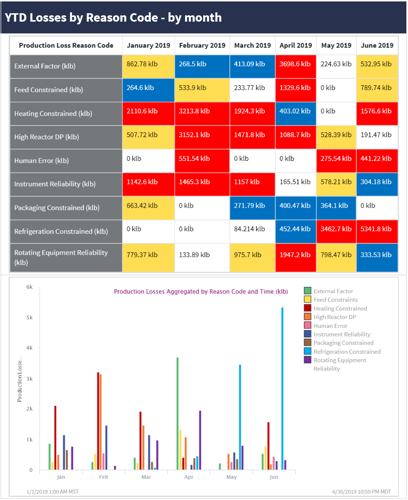
- Solution: Seeq is used to identify performance losses by comparing actual operation to ideal and creating conditions when operation is constrained. Losses are categorized using Seeq conditions, where events can be placed in the correct categorical buckets either manually or logically, based on configured thresholds. Summary visualizations are created in Seeq to represent the losses graphically and tabularly and compiled into a dashboard where scheduled date ranges are used to automatically generate periodic reports, complete with collaboration and sharing capabilities (FIG. 1).

FIG. 1. Diagram snipped from a Seeq production loss anlaysis dashboard for a petrochemcial production unit. (Source: Seeq)
- Result: Automatically generated monthly reports can save one to five days per month of valuable process engineering time. Easily exportable historical loss data enables engineers to spend more time adding value to improvement projects and less time developing cost justifications.
Production run length optimization
- Challenge: Many manufacturing units hit process throughput constraints over the course of a run, resulting in degradation of production rate. These constraints are often reversible, but at the cost of rate or quality losses during maintenance or online procedures. The decision to shut down and clean equipment, regaining throughput rate upon startup, can enable units to meet production goals sooner, which translates into more production and increased profits in the long term. Solutions to these types of optimization problems require complex calculus, along with advanced modeling packages and programming experience.
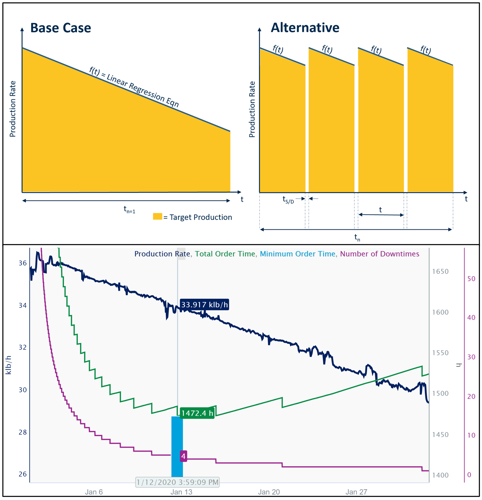
- Solution: Seeq was used to calculate the number of shutdowns that would minimize the total time required to produce a given order size. After determining the optimal number of shutdown/run cycles, engineers were able to determine the proper rate trigger for mid-run maintenance. The forecasted profile was used to compare the actual production rate to target to understand where the projected end-of-run date stood compared to the best-case order fulfillment date (FIG. 2).

FIG. 2. Sketch depicting the optimization problem to be solved (top) and the Seeq graphical solution to the problem (bottom). (Source: Seeq)
- Result: A sold-out production unit had been looking at ways to increase capacity to meet demand. By implementing this proactive downtime strategy, they were able to meet supply chain targets an average of 11% sooner over the course of the year, growing sales and market share.
Takeaway. Reporting, complex calculations, modeling and other tasks required for analysis of time series process data have traditionally been performed using spreadsheets. As data volumes grow, along with pressures to increase personnel productivity, new solutions are needed to deal with these and other issues.
Advanced analytics applications specifically designed to deal with time-series process data provide a solution. As the use cases demonstrate, using the right tool for the job repeatedly saves hours or days of a process engineer’s time, freeing these valuable individuals to work on higher value activities to optimize production.
ABOUT THE AUTHOR
Allison Buenemann is an Industry Principal at Seeq Corporation. She has a process engineering background with a BS degree in chemical engineering from Purdue University and an MBA from Louisiana State University. Ms. Buenemann has more than five years of experience working for and with chemical manufacturers to solve high-value business problems leveraging time series data. As a Senior Analytics Engineer with Seeq, she was a demonstrated customer advocate, leveraging her process engineering experience to aid in new customer acquisition, use case development and enterprise adoption. In her current role, she enjoys monitoring the rapidly changing trends surrounding digital transformation in the chemical industry and translating them into product requirements for Seeq.


Comments